Gallery
Some example installations, usually running live data feeds through them.
luftdaten.info
About
Acquisition of sensor data from the LDI network.
Adapter
Implemented by luftdatenpumpe.source.luftdaten_info
Dashboards
Screenshots
Fine dust pollution on New Year’s Eve 2018 | Animation of fine dust pollution on New Year’s Eve 2018 across Europe
References
Labs
DHT22
About
An analysis of the results of DHT22 humidity sensors.
Screenshots
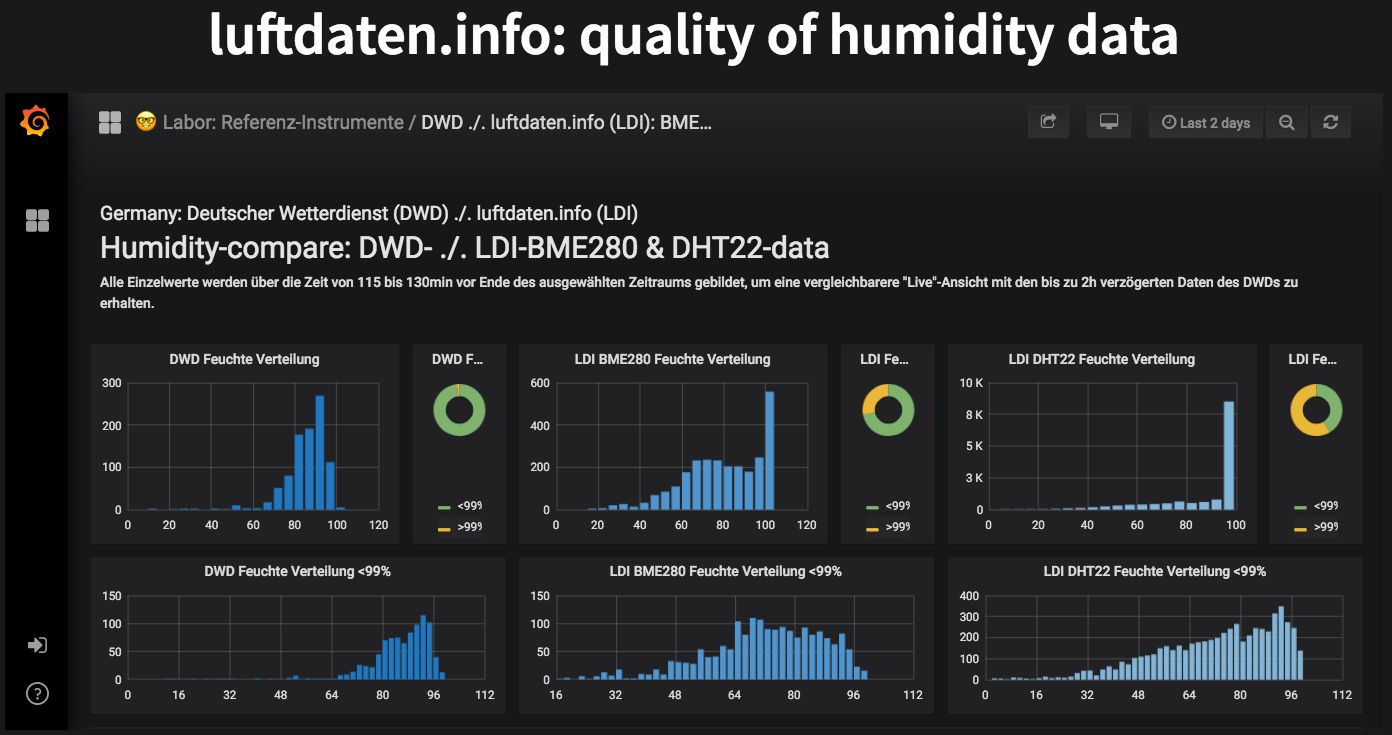
Analyzing DHT22 measurement values on the LDI network.
IRCELINE
About
Air quality monitoring for the Flanders Environment Agency in Belgium.
Luftdatenpumpe helped VMM to support their work for the Belgian Interregional Environment Agency (IRCEL - CELINE) on air quality monitoring within the EU-funded Corona EU and VAQUUMS projects.
More details about this can be found at Supporting the Flanders Environment Agency (VMM) by analyzing and visualizing air quality sensor data with InfluxDB and Grafana.
Adapter
Implemented by luftdatenpumpe.source.irceline
Dashboards
Screenshots
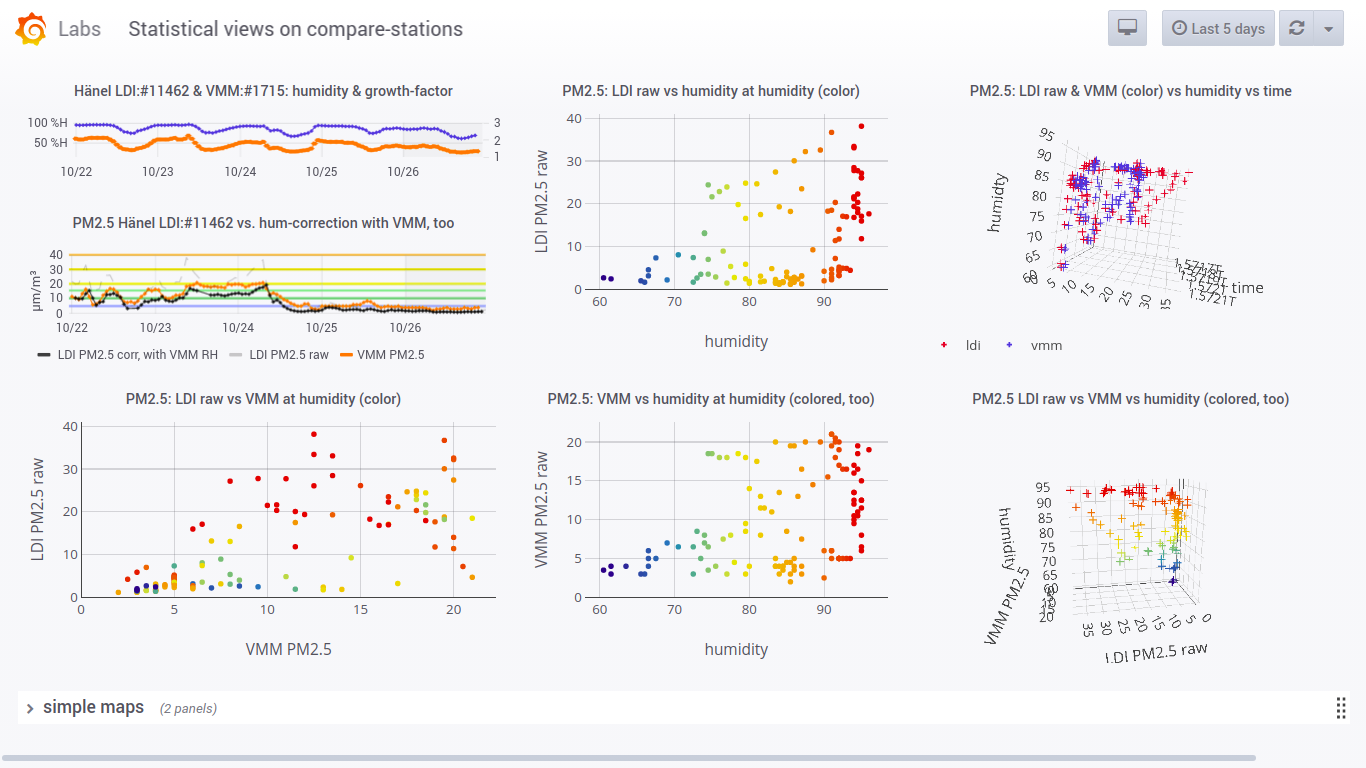
Comparing air quality sensors.
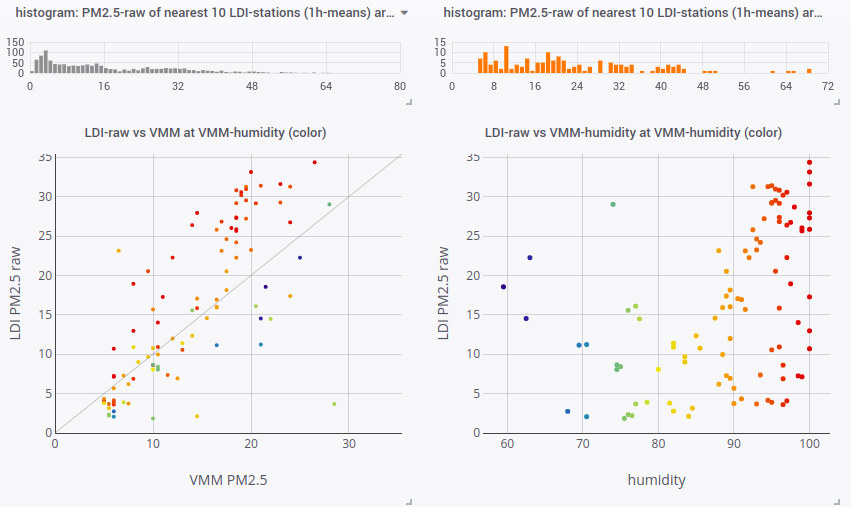
Comparing air quality sensors.
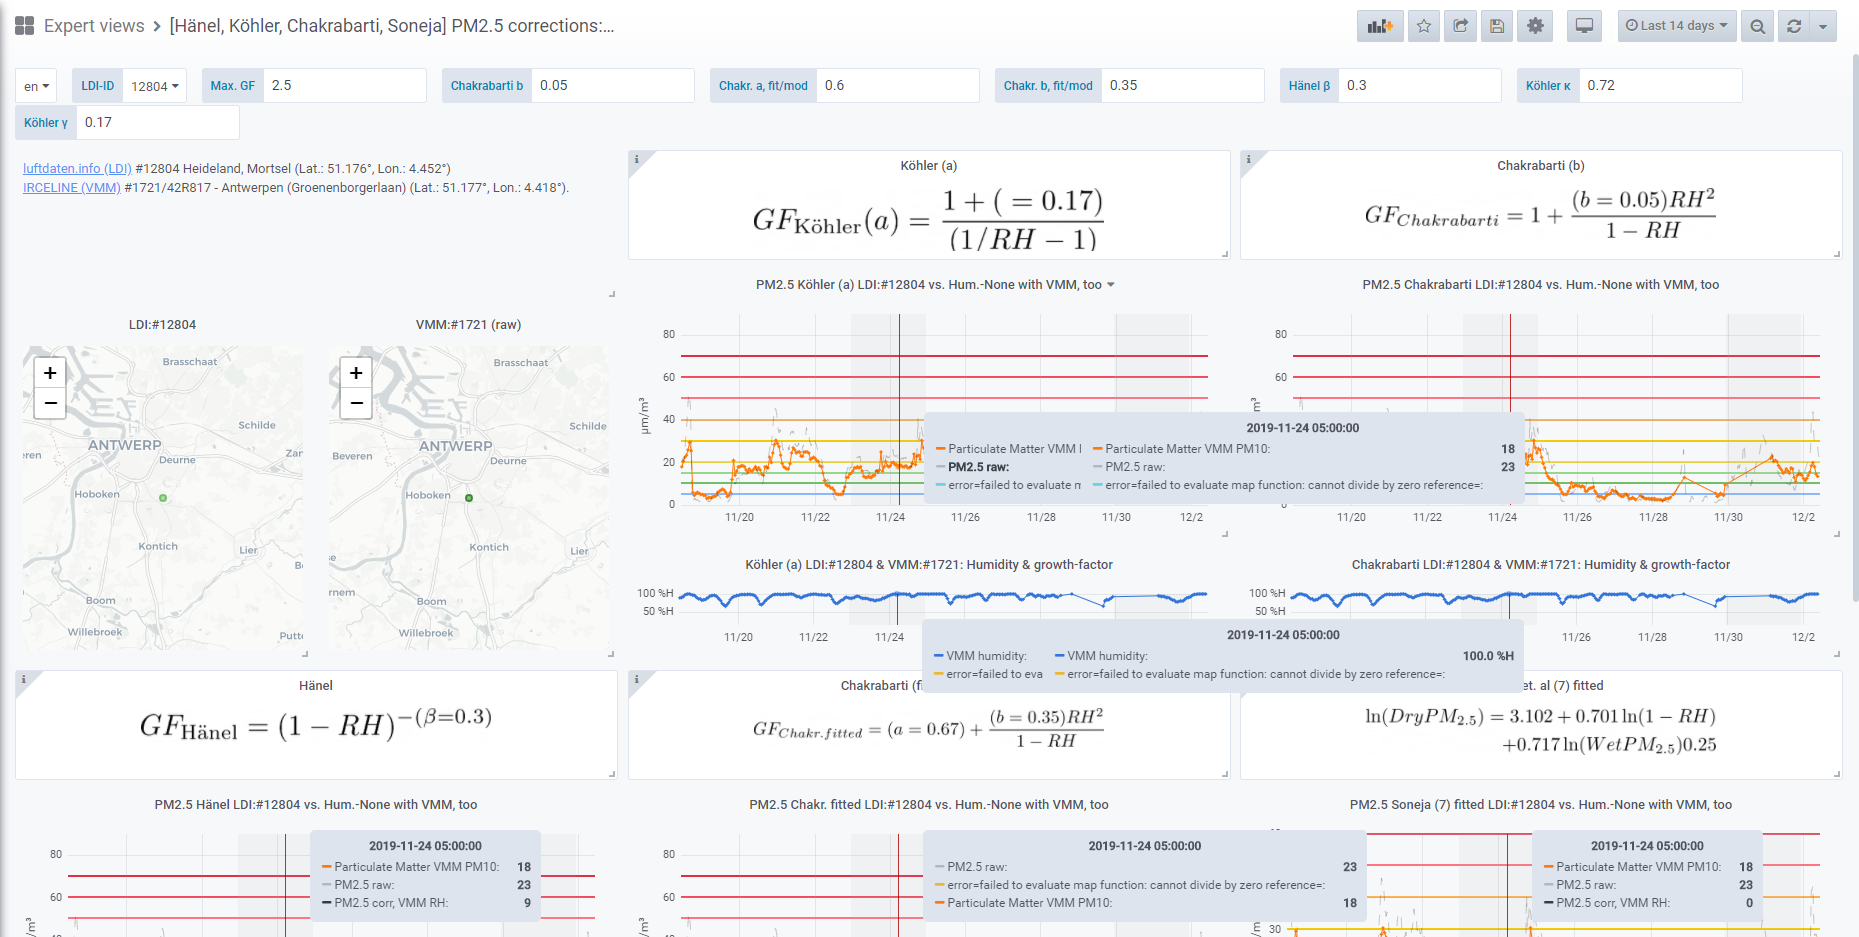
Humidity compensation for air quality sensors.